Your watch is smarter than you think: decoding the data beyond steps and sleep
7 December 2025|Written by: Dream Chronicler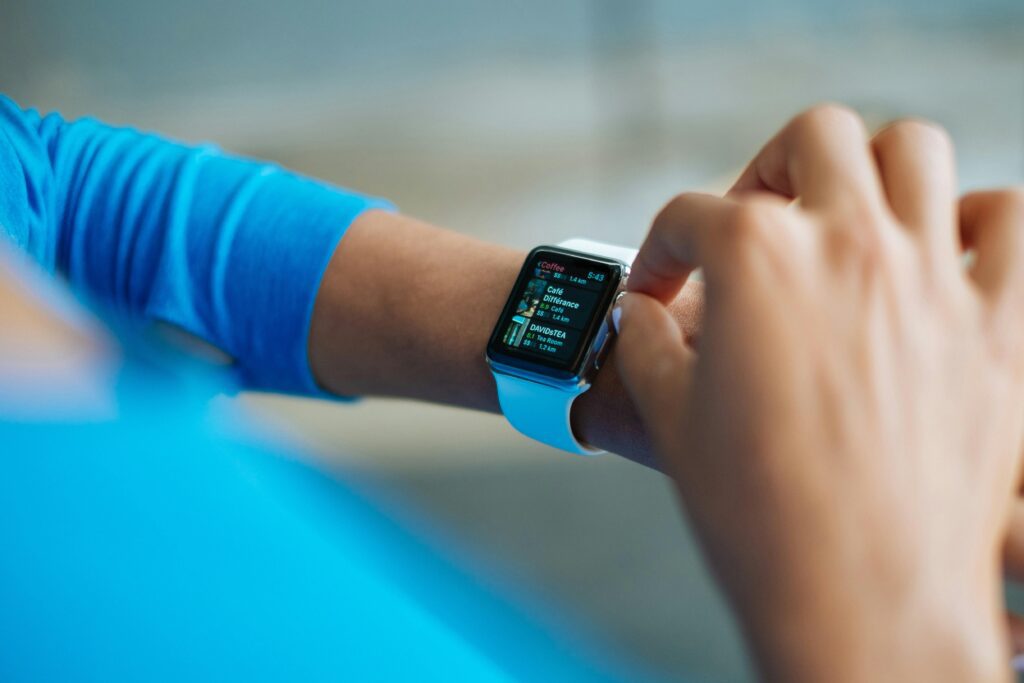
You likely wear it every day. It buzzes when you get a text, nudges you when you’ve been sitting too long, and gives you a satisfying little celebration when you hit your step count. Whether it’s an Apple Watch, a Garmin, or an Oura Ring, wearable technology has become as essential to the modern athlete’s kit as a good pair of running shoes.
But here is the truth: most of us are using a Ferrari to go to the grocery store.
We glance at the step count, maybe check the sleep score to confirm why we feel groggy, and then move on. Meanwhile, these devices are collecting a goldmine of physiological data that can tell you exactly when to push for a PB, when to back off to avoid injury, and whether that late-night Pinot Noir actually wrecked your recovery.
If you are serious about performance, whether that means crushing a CrossFit WOD, training for a marathon, or just staying injury-free in your 40s, you need to look beyond the basic dashboard.
This guide will take you deep into the metrics that actually matter. We will decode the science of Heart Rate Variability, explain why your Resting Heart Rate is a crystal ball for stress, and show you how to turn raw data into real-world results.
The Big Two: Why Steps and Sleep Scores Are Just the Surface
Before we dive into the advanced metrics, let’s address the elephant in the room. Steps and Sleep Scores are the “vanity metrics” of the wearable world. They aren’t useless, but they are incomplete.
The Limitation of Steps
Steps are a measure of volume, not intensity or physiological cost. Walking 10,000 steps while shopping is metabolically different from running 10,000 steps in a threshold workout. If you are an athlete, “steps” is rarely the metric that will drive your adaptation. It’s a baseline for general activity, not a tool for peak performance.
The “Sleep Score” Trap
Most devices give you a score out of 100 for your sleep. While helpful for a quick check-in, this aggregate number often hides the details. You might score an “85” because you slept for 9 hours, but if you had zero Deep Sleep and woke up six times, your physiological recovery might actually be poor.
To get the best return on investment (ROI) from your wearable, you need to stop looking at the summary and start looking at the engine.
Heart Rate Variability (HRV): Your Body’s Check Engine Light
If you track only one advanced metric, make it Heart Rate Variability (HRV).
HRV is not the same as heart rate. Your heart doesn’t beat like a metronome; there are tiny variations in the time intervals between heartbeats. If your heart beats at 60 beats per minute, it doesn’t beat exactly once every second. One interval might be 0.9 seconds, the next 1.1 seconds.
High HRV is good. It means your nervous system is balanced, responsive, and ready to handle stress.
Low HRV is a warning. It suggests your body is in “fight or flight” mode, struggling to recover from stress, illness, or overtraining.
What HRV Tells You About Recovery
HRV is the most accurate non-invasive way to measure the state of your Autonomic Nervous System (ANS).
- Sympathetic Nervous System: The “fight or flight” system. When this is dominant (stress, exercise), HRV goes down.
- Parasympathetic Nervous System: The “rest and digest” system. When this is dominant (recovery, sleep), HRV goes up.
How to Use HRV in Your Training
Don’t obsess over the raw number (which varies wildly between people based on age and genetics). Instead, watch the trend relative to your baseline.
- Green Light (Baseline or Higher): Your body is recovered. This is the day to tackle high-intensity intervals or heavy lifts.
- Yellow Light (Slightly Below Baseline): You are carrying some fatigue. You can still train, but maybe keep it to aerobic Zone 2 work or technical drills rather than max effort.
- Red Light (Significantly Below Baseline): Your system is overloaded. This could be due to yesterday’s workout, a looming virus, work stress, or alcohol. Prioritise sleep and active recovery. Pushing hard today increases injury risk.
Pro Tip: Alcohol is an HRV killer. Try checking your HRV the morning after just two drinks. You will often see a double-digit drop, proving that even moderate drinking impacts recovery significantly.
Resting Heart Rate (RHR): The Measure of Efficiency
Resting Heart Rate is exactly what it sounds like: how fast your heart beats when you are completely relaxed, usually measured while you are sleeping or right before you get out of bed.
For the general population, a normal RHR is between 60 and 100 beats per minute (bpm). For fit athletes, it is often much lower, commonly between 40 and 60 bpm.
Why RHR Matters
As your cardiovascular fitness improves, your heart becomes more efficient. It pumps more blood with each beat (stroke volume), meaning it doesn’t have to beat as often to do the same job.
Conversely, a sudden spike in RHR is a loud alarm bell.
How to Action RHR Data
- The Long-Term Trend: If your RHR is slowly trending down over weeks or months, your cardio training is working. You are getting fitter.
- The Sudden Spike: If your RHR jumps up by 5 beats or more overnight, it is a strong indicator of:
- Illness: Your body raises your heart rate to fight off an infection (often before you feel symptoms).
- Dehydration: Thicker blood requires the heart to work harder.
- Overtraining: Your sympathetic nervous system is stuck in overdrive.
- Late Meals/Alcohol: Digestion raises metabolic rate and heart rate.
If you wake up and your RHR is +5 bpm above normal and your HRV is tanked, take a rest day. Your body is shouting at you.
Respiratory Rate: The Silent Sentinel
Respiratory rate—how many breaths you take per minute while sleeping—is a metric that rarely gets the spotlight, but it is incredibly stable. A healthy adult typically breathes 12 to 20 times per minute.
Unlike HRV or RHR, which fluctuate with training load, your respiratory rate should remain almost flat every single night.
The “Canary in the Coal Mine”
Because it is so stable, a deviation is significant. A sudden increase in respiratory rate (even just 1 or 2 breaths per minute above average) is strongly correlated with respiratory tract infections.
During the height of the pandemic, wearable companies like Oura and WHOOP found that respiratory rate spikes often predicted COVID-19 days before symptoms appeared. If you see this metric climb, it’s time to hydrate, dose up on Vitamin C, and cancel that heavy squat session.
Deep Sleep vs. REM Sleep: Quality Over Quantity
We mentioned earlier that “Total Sleep Time” isn’t enough. To optimise performance, you need to understand the architecture of your sleep. Your wearable breaks sleep stages down into Light, Deep, and REM.
Deep Sleep (The Body Builder)
Deep sleep (or slow-wave sleep) is physically restorative. This is when your body releases Growth Hormone (HGH), repairs muscle tissue, strengthens bones, and scrubs the brain of metabolic waste.
- Target: 15–20% of your total sleep.
- Athlete focus: If you are physically training hard, you need deep sleep to repair the damage. Heavy meals or alcohol before bed tend to crush deep sleep.
REM Sleep (The Brain Builder)
Rapid Eye Movement (REM) sleep is mental restoration. This is when memory consolidation happens, emotional processing occurs, and new motor skills (like learning a snatch technique) are cemented in the brain.
- Target: 20–25% of your total sleep.
- Athlete focus: If you are feeling mentally foggy, irritable, or struggling with coordination, you might be REM deprived. Stress often fragments REM sleep.
VO2 Max: Your Aerobic Ceiling
Most high-end wearables now estimate your VO2 Max (sometimes called Cardio Fitness). This measures the maximum amount of oxygen your body can utilise during intense exercise.
While a wrist-based estimate isn’t as accurate as a lab test with a gas mask, it is surprisingly reliable for tracking trends.
Why You Should Care
VO2 Max is strongly linked to longevity and endurance performance. A higher VO2 Max means you have a bigger “engine.”
- How to improve it: You cannot improve VO2 Max just by walking or easy jogging. You need high-intensity output. HIIT sessions, hill sprints, and efforts that push your heart rate to 90–95% of its max are required to nudge this number up.
Blood Oxygen (SpO2): The Altitude Adjustment
SpO2 measures the saturation of oxygen in your blood. For most healthy people at sea level, this should be between 95% and 100%.
When to Watch It
For the average city-dwelling athlete, this metric is usually boring (it stays the same). However, it becomes critical in two scenarios:
- Sleep Apnea: If your SpO2 drops significantly and frequently during the night, it might indicate sleep apnea (stopping breathing), which destroys recovery and health.
- Altitude Training: If you travel to high altitude to train (or ski), your SpO2 will drop. Watching it climb back up over days indicates how well you are acclimating.
Training Readiness and Body Battery: The Aggregate Scores
Garmin has “Body Battery” and “Training Readiness”; Oura has “Readiness”; WHOOP has “Recovery.”
These are proprietary algorithms that mash up all the metrics we just discussed (Sleep, HRV, RHR, Stress history) into one simple score.
Are They Reliable?
Generally, yes. They are excellent for a quick “at a glance” decision. If your Garmin says your Training Readiness is 1/100, do not try to run a marathon PB.
However, use them as a guide, not a dictator. If your readiness score is mediocre but you feel fantastic, listen to your body. If your score is high but you feel like you’ve been hit by a truck, respect the feeling. Subjective feel plus objective data is the ultimate combination.
Practical Application: How to Use This Data Today
You have the data. Now, how do you actually change your behaviour? Here is a simple framework for integrating wearable insights into your training routine.
1. The Morning Check-In (1 Minute)
Don’t check your phone notifications first. Check your physiological status.
- Look at HRV: Is it within your baseline range?
- Look at RHR: Is it stable?
- Look at Sleep Stages: Did you get enough Deep sleep for physical repair?
Decision:
- All good? Stick to the plan. Go hard.
- Metrics tanked? Modify the plan. Switch a HIIT session to Zone 2, or a heavy lift to mobility work.
2. The Stress Audit
Notice your stress scores spiking during the workday while you are just sitting at your desk? That is physiological stress.
- Action: When you see high stress during sedentary periods, implement a 5-minute breathwork protocol (like box breathing). You will literally see your HRV rise and stress score drop in real-time.
3. The Pre-Bed Routine
Your wearable is the ultimate accountability partner for your evening routine.
- Experiment: Try eating dinner 3 hours before bed instead of 1 hour. Watch what happens to your RHR and Deep Sleep.
- Experiment: Try a cold dark room vs. a warm one.
- Experiment: Try a magnesium supplement.
Gamify your recovery. Use the data to prove what works for your biology.
Don’t Be a Slave to the Algorithm
A final word of warning: Data anxiety is real.
Some athletes wake up, see a low recovery score, and psychologically defeat themselves before they even tie their laces. This is the “Nocebo Effect.”
Wearables are tools for awareness, not judgement. They are there to help you spot trends and prevent burnout, not to dictate your self-worth. If the numbers are stressing you out, take the watch off for a week and reconnect with how your body feels.
Maximise Your Investment
You spent hundreds (maybe thousands) of dollars on that device on your wrist. It is capable of acting as a 24/7 lab coat, analyzing your biology to help you perform better, sleep deeper, and live longer.
Don’t just count steps. Listen to your heart.